EUTROPHICATION IN LAKES AND SOME PHYSICOCHEMICAL PARAMETERS MEASUREMENT
Trophic States
- Terms
oligotrophic ("little food") and eutrophic ("well
fed") were first used to describe soil fertility in northern
- This
trophic classification of lakes was first developed largely on the basis
of benthic invertebrates present in the deep water sediments. Some species
were found to be more sensitive to low oxygen than others. This in turn
could be related to classification as oligotrophic, mesotrophic, and
eutrophic. Note that as originally proposed, only oligotrophic and
eutrophic were defined.
1.
OLIGOTROPHIC LAKES - tend to be deep with
mean depths > 15 m and maximum depths > 25 m. Waters are transparent and
have low density of plant life occurring at various depths. Nutrient supply is
low in relation to the volume of water and dominant fish tend to be coldwater species
such as lake trout.
2.
EUTROPHIC LAKES - are shallow with mean
depths < 10 m and maximum depths < 50 m, have high nutrient supply in
relation to volume and dense growths of plankton in the surface waters. Water
column is turbid and biological productivity is high at all levels. Dominant
fish tend to be warm water.
3.
Based on knowledge that oligotrophic lakes
are deep and eutrophic lakes are shallow, it was inferred that lakes must
evolve toward a condition of eutrophy over geological periods of time. Thus,
the ultimate fate of lakes was to become filled with sediments and eventually
supplanted by grassed or forests. Lakes accumulate sediments at an average rate
of about 1 mm/yr. Support for the idea that there is a successional process in
lakes from oligotrophic to eutrophic was found through examinations of the
fossil remains of indicator organisms in the sediments. The deepest sediments
(oldest deposits) tended to have a greater abundance of organisms found in well
oxygenated conditions and the shallowest sediments (most recently deposited)
tend to have more organisms tolerant of low oxygen conditions.
Despite some evidence to the contrary, there is widespread acceptance of the
PROCESS OF NATURAL EUTROPHICATION. Natural eutrophication is complex,
immeasurably slow (geological time periods), and, for all practical purposes,
it is irreversible under a given set of climatic conditions. It is caused by
the change in form and depth of the basin as it gradually fills in with
sediment. To reverse natural eutrophication, you would have to scour out the
lake basin; a formidable task under any circumstances and certainly not
practical with current technology! Nutrient supply does not change, or if it
does, it decreases as soils become exhausted.
Cultural Eutrophication
Human settlement in the drainage basin of a
lake generally leads to clearing of the natural vegetation, the development
of farms and cities. These activities in turn accelerate runoff from the land
surface and increase the input of plant nutrients, i.e., the rate of nutrient
supply is increased. Also, streams were convenient for disposing of household
wastes and sewage, adding to the nutrient load in the receiving water body. The
addition of plant nutrients stimulates the growth of algae and other plants
which in turn stimulates fish and other organisms in the food web. This
phenomenon is called CULTURAL EUTROPHICATION.
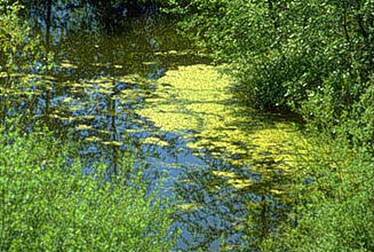
Cultural eutrophication is characterized
by an intense proliferation of algae and higher plants and their accumulation
in excessive quantities, which can result in detrimental changes in water
quality and biological populations and can interfere with human uses of that waterbody.
The perceived negative effects of cultural
eutrophication include reduced water transparency and excessive algal and plant
growth, which is highly visible and can interfere with uses and aesthetic
quality of water. One consequence of such growths may be taste and odour
problems in drinking water. Ecological consequences include hypolimnetic anoxia
due to algal decomposition and fish kills
Cultural eutrophication is the rapid
enrichment of water with nutrients derived from human activities. Main
nutrients are P and N and they are derived from sewage, agricultural and
livestock holding operations. This process is the result of an increase in
nutrient supply to a constant volume of water, without any appreciable change
in depth or form of the basin, as in natural eutrophication.
|
|
Type of lake |
|
|
Parameter |
Oligotrophic |
Eutrophic |
|
Aquatic plant production |
Low |
High |
|
Aquatic animal production |
Low |
High |
|
Aquatic plant nutrient flux |
Low |
High |
|
Oxygen in the hypolimnion |
Present |
Absent |
|
Depth |
Tend to be deeper |
Tend to be shallower |
|
Water quality for most
domestic and industrial uses |
Good |
Poor |
|
Total salts or conductance |
Usually lower |
Sometimes higher |
|
Number of plant and animal
species |
Many |
Fewer |
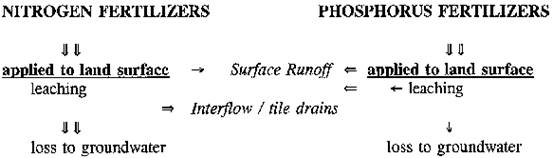
The control of eutrophication is normally based
on limiting aquatic plant nutrient input. Such control efforts must be directed
toward the element which is currently limiting or can be made to limit algal
growth in the body of water of concern. Domestic wastewaters represent
potentially significant sources of nitrogen and phosphorus for the excessive
fertilization of surface waters. Eutrophication control efforts are generally
directed toward limiting the phosphorus content of domestic wastewaters by
precipitation or co-precipitation treatment methods involving the use of
aluminum or iron salts or lime. Other potentially significant sources of
nitrogen and phosphorus include urban and rural stormwater
drainage and atmospheric inputs.
The control of
nitrogen and phosphorus from urban and rural diffuse sources is a much more
difficult task and will require the expenditure of large amounts of funds if
excessive fertilization of natural waters it to be minimized to the greatest
possible tent
- Physical parameters:
Colour, Temperature, Turbidity and Odour.
- Chemical parameters: pH,
Electrical Conductivity (E.C), Total Solids
(TS), Total Dissolved Solids (TDS), Total
Suspended Solids (TSS), Total Hardness, Calcium
Hardness, Magnesium Hardness, Nitrates, Phosphates, Sulphates, Chlorides,
Dissolved Oxygen (D.O), Biological Oxygen Demand
(BOD), Chemical Oxygen Demand (COD), Fluorides,
Free Carbon-di-oxide, Potassium and Sodium.
- Heavy metals: Lead,
Copper, Nickel, Iron, Chromium, Cadmium and Zinc.
- Biological parameters: The biological parameters involved the qualitative analyses of
planktons (zooplankton and phytoplankton).
Colour
In natural water, colour is due to the presence of acids, metallic ions,
suspended matter, plankton, weeds and industrial effluents. Colour is removed
to make water suitable for general and industrial applications and is determined
by visual comparison of the sample with distilled water.

pH
The pH
of a sample of water is a measure of the concentration of hydrogen ions. The
term pH was derived from the manner in which the hydrogen ion concentration is calculated
- it is the negative logarithm of the hydrogen ion (H+)
concentration. What this means to those of us who are not mathematicians is
that at higher pH, there are fewer free hydrogen ions,
and that a change of one pH unit reflects a tenfold change in the
concentrations of the hydrogen ion. For example, there are 10 times as many
hydrogen ions available at a pH of 7 than at a pH of 8. The pH scale ranges
from 0 to 14. A pH of 7 is considered to be neutral. Substances
with pH of less that 7 are acidic; substances with pH greater than 7 are basic.
Limiting pH Values
|
||
Min |
Max |
Effects |
3.8 |
10.0 |
Fish eggs could be hatched, but deformed young are often produced |
4.0 |
10.1 |
Limits for the most resistant fish species |
4.1 |
9.5 |
Range tolerated by trout |
--- |
4.3 |
Carp die in five days |
4.5 |
9.0 |
Trout eggs and larvae develop normally |
4.6 |
9.5 |
Limits for perch |
--- |
5.0 |
Limits for stickleback fish |
5.0 |
9.0 |
Tolerable range for most fish |
--- |
8.7 |
Upper limit for good fishing waters |
5.4 |
11.4 |
Fish avoid waters beyond these limits |
6.0 |
7.2 |
Optimum (best) range for fish eggs |
--- |
1.0 |
Mosquito larvae are destroyed at this pH value |
3.3 |
4.7 |
Mosquito larvae live within this range |
7.5 |
8.4 |
Best range for the growth of algae |
The
pH of water determines the solubility (amount that can be dissolved in the
water) and biological availability (amount that can be utilized by aquatic
life) of chemical constituents such as nutrients (phosphorus, nitrogen, and
carbon) and heavy metals (lead, copper, cadmium, etc.). For example, in
addition to affecting how much and what form of phosphorus is most abundant in
the water, pH may also determine whether aquatic life can use it. In the case
of heavy metals, the degree to which they are soluble determines their
toxicity. Metals tend to be more toxic at lower pH because they are more
soluble.
When pollution results in higher algal and plant growth (e.g., from
increased temperature or excess nutrients), pH levels may increase, as allowed
by the buffering capacity of the lake. Although these small changes in pH are
not likely to have a direct impact on aquatic life, they greatly influence the
availability and solubility of all chemical forms in the lake and may aggravate
nutrient problems. For example, a change in pH may increase the solubility of
phosphorus, making it more available for plant growth and resulting in a
greater long-term demand for dissolved oxygen.
Generally,
during the summer months in the upper portion of a eutrophic
lakes, pH will range between 7.5 and 8.5. In the bottom of the lake or
in less productive lakes, pH will be lower, 6.5 to 7.5, perhaps.
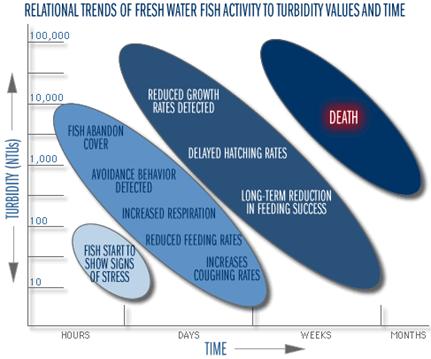
Turbidity
|
Even relatively small amounts of wave action can erode exposed
lakeshore sediments, in this case a minepit lake
from northeastern |

Turbidity
refers to how clear the water is. The greater the amount of total suspended
solids (TSS) in the water, the murkier it appears and
the higher the measured turbidity. The major source of turbidity in the open
water zone of most lakes is typically phytoplankton, but closer to shore,
particulates may also be clays and silts from shoreline erosion, resuspended
bottom sediments, and organic detritus from stream and/or wastewater
discharges.
High
concentrations of particulate matter can modify light penetration, cause
shallow lakes and bays to fill in faster, and smother benthic habitats -
impacting both organisms and eggs. If light penetration is reduced significantly,
macrophyte growth may be decreased which would in turn impact the organisms
dependent upon them for food and cover. Reduced photosynthesis can also result
in a lower daytime release of oxygen into the water. Effects on phytoplankton
growth are complex depending on too many factors to generalize.
Very high levels of turbidity for a short period of time may not be
significant and may even be less of a problem than a lower level that persists
longer.
Schematic adapted from
"Turbidty: A Water Quality Measure", Water
Action Volunteers, Monitoring Factsheet Series.
Turbidity
is reported in nephelometric units (NTUs), but may
also be measured in Jackson Turbidity Units (JTU).
Waters with a turbidity level of > 5 NTU are not
safe for recreational use or human consumption. Levels > 25 NTU cannot sustain Aquatic life.
The
easiest and cheaper method to measure the water turbidity is using the Secchi Disk
Secchi disk
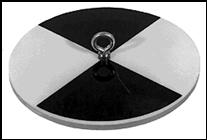
A Secchi disk is a circular plate
divided into quarters painted alternately black and white. The disk is attached
to a rope and lowered into the water until it is no longer visible. Secchi disk
depth, then, is a measure of water clarity. Higher Secchi readings mean more
rope was let out before the disk disappeared from sight and indicates clearer water.
Lower readings indicate turbid or colored water. Clear water lets light
penetrate more deeply into the lake than does murky
water. This light allows photosynthesis to occur and oxygen to be produced. The
rule of thumb is that light can penetrate to a depth of about 2 - 3 times the
Secchi disk depth.
Taking
a Secchi Disk reading
- Tie a
wrist loop at the end of the rope so the rope end does not accidentally
drop into the water when the disk is lowered.
- Lower the
disk into the water until the disk just disappears from sight.
- Record
the amount of rope submerged to the nearest one -tenth meter (i.e., note
the point where the rope and water line meet).
- Raise
the disk slowly until the disk just becomes visible and record this depth
as well.
- Average
the two recorded values. This average is called the limit of visibility.
If the disk hits the bottom before dropping out of sight, note this
observation and record the bottom depth.
|
Trophic status |
Secchi depth |
|
Oligotrophic |
9.9 |
|
¯ |
|
|
Mesotrophic |
4.2 |
|
¯ |
|
|
Eutrophic |
2.45 |
|
¯ |
|
|
Hypertrophic |
0.4-0.5 |
Temperature
Most aquatic organisms are poikilothermic - i.e.,
"cold-blooded" - which means they are unable to internally regulate
their body temperature. Therefore, temperature exerts a major influence on the
biological activity and growth of aquatic organisms. To a
point, the higher the water temperature, the greater the biological activity.
Fish, insects, zooplankton, phytoplankton, and other aquatic species all have
preferred temperature ranges. As temperatures get too far above or below this
preferred range, the number of individuals of the species decreases until
finally there are few, or none.
|
|
|
Changes in the growth rates of
cold-blooded aquatic organisms and many biochemical reaction rates can often
be approximated by this rule which predicts that growth rate will double if
temperature increases by 10°C (18°F) within their "preferred"
range. |

Temperature is also important because of its influence on water
chemistry. The rate of chemical reactions generally increases at higher
temperature, which in turn affects biological activity. An important example of
the effects of temperature on water chemistry is its impact on oxygen. Warm
water holds less oxygen that cool water, so it may be saturated with oxygen but
still not contain enough for survival of aquatic life.
Thermal pollution (i.e., artificially high temperatures) almost always
occurs as a result of discharge of municipal or industrial effluents. Except in
very large lakes, it is rare to have an effluent discharge
Mid-summer, when strong thermal stratification develops in a lake, may be a very hard time for fish. Water near the surface of the lake - the epilimnion - is too warm for them, while the water near the bottom - the hypolimnion - has too little oxygen. Anoxia forces the fish to spend more time higher in the water column where the warmer water is suboptimal for them. This may also expose them to higher predation, particularly when they are younger and smaller.
Phosphates
Phosphorus is one of the key elements necessary for growth of plants and
animals. Phosphorus in elemental form is very toxic and is subject to
bioaccumulation.
Phosphates occur in natural or wastewaters as orthophosphates, condensed phosphates and naturally found phosphates. Their presence in water
is due to detergents, fertilizers and biological processes. They occur in
solution in particles or as detritus. They are essential for the growth
of organisms and a nutrient that limits the primary productivity of the water
body. Inorganic phosphorus plays a dynamic role in aquatic ecosystems; when
present in low concentration is one of the most important nutrients, but if the
rainfall can cause varying amounts of phosphates to wash from farm soils into
nearby waterways. Phosphate will stimulate the growth of plankton and aquatic
plants which provide food for fish. This increased growth may cause an increase
in the fish population and improve the overall water quality. However, if an
excess of phosphate enters the waterway, algae and
aquatic plants will grow wildly, choke up the waterway and use up large amounts
of oxygen. It is calculated by the stannous chloride (SnCl2) method.
|
Concentration of Phoshorus in lakes |
|
Oligotrofic < 0,015 mg P/l |
Mesotrofic 0,015-0,025 mg P/l
|
|
Eutrofic 0,025-0,1 mg P/l |
|
Very eutrofic > 0,1
mg P/l |
Nitrates
Nitrogen is one of the most abundant elements. About 80 percent of the
air we breath is nitrogen. It is found in the cells of
all living things and is a major component of proteins. Inorganic nitrogen may
exist in the
Nitrates are the most oxidized forms of nitrogen and the end product of the aerobic decomposition of organic nitrogenous matter. The significant sources of nitrates are chemical fertilizers from cultivated lands, drainage from livestock feeds, as well as domestic and industrial sources. Natural waters in their unpolluted state contain only minute quantities of nitrates. The stimulation of plant growth by nitrates may result in eutrophication, especially due to algae. The subsequent death and decay of plants produces secondary pollution. The main source of polluting nitrates is domestic sewage. Nitrates may find their way into ground water through leaching from soil and at times by contamination. They can be measured by the phenoldisulphonic method.
|
NO3-N Level |
Water Quality |
|
0 - 1.0 |
Excellent |
|
1.1 - 3.0 |
Good |
|
3.1 - 5.0 |
Fair |
|
5.0 or greater |
Poor |